
An overview
ChIP-seq, or chromatin immunoprecipitation sequencing, is a powerful tool used to study protein-DNA interactions in the genome. It allows researchers to identify the binding sites of transcription factors, histones, and other proteins of interest and can provide insight into gene regulation and the role of non-coding DNA.
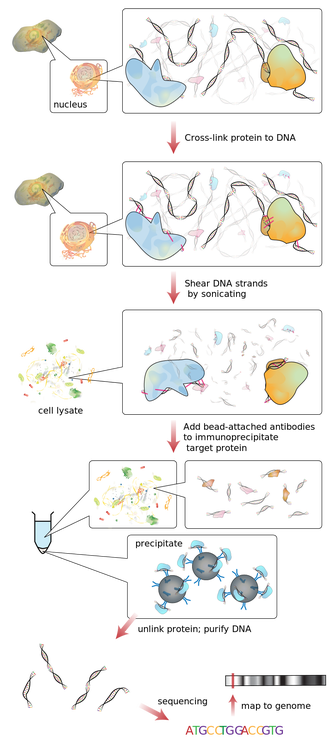
ChIP-seq experiments involve three main steps:
- Chromatin immunoprecipitation (ChIP): This step involves enriching for the protein of interest and the DNA fragments that are bound to it. This is done by crosslinking the protein and DNA, fragmenting the chromatin, and then using an antibody to pull down the protein-DNA complexes.
- DNA purification: The enriched DNA fragments are then purified and prepared for sequencing.
- Sequencing: The purified DNA fragments are sequenced using high-throughput sequencing technology, such as Illumina or PacBio.
The resulting ChIP-seq data is a large fastq file containing the sequences of all of the DNA fragments that are bound to the protein of interest. These binding sites can be identified using a series of bioinformatic tools and then annotated to identify the genes and functional elements within them.
ChIP-seq has numerous applications in areas such as functional genomics, epigenomics, and gene regulation. It is a widely used technique that has greatly enhanced our understanding of the genome and its function.
Deconstructing the Steps for Analyzing ChIP-seq Data: Quality Control, Read Alignment, Peak Calling, and More
Here are the general steps for analyzing ChIP-seq data:
- Quality control: Before analyzing the data, it is important to check the quality of the ChIP-seq reads. This can be done using tools such as FastQC.
- Read alignment: Next, the ChIP-seq reads need to be aligned to a reference genome. This can be done using tools such as Bowtie or BWA.
- Peak calling: Once the reads are aligned, peak calling algorithms such as MACS2 can be used to identify regions in the genome that have a high density of reads (called peaks) which implies that the protein of interest has bound to that region.
- Annotation: The identified peaks can be annotated to identify the genes, transcription factor binding motifs, and functional elements within them. Tools such as HOMER andcan be used for this purpose.
- Functional analysis: To understand the functional impact of the identified peaks, analysis such as Gene Ontology (GO) analysis or pathway analysis can be applied to enriched motifs and gene annotations.
- Data visualization: To visualize the results of the analysis, tools such as R and ggplot2 can be used to create plots and graphs.
Overall, analyzing ChIP-seq data may require a combination of specialized software and bioinformatics skills. It is important to carefully plan and design the experiment and choose the most appropriate analysis tools to ensure accurate and reliable results.
A Look at Available Pipelines
Analyzing ChIP-seq data can be complex and time-consuming, as it involves several steps including read alignment, peak calling, annotation, and functional analysis. To streamline the process and make it more efficient, several pipelines have been developed that automate these steps and provide a user-friendly interface.
Here are a few examples of ChIP-seq analysis pipelines:
- Galaxy: Galaxy is an open-source platform that provides a web-based interface for analyzing ChIP-seq data. It includes a range of tools for read alignment, peak calling, annotation, and functional analysis, and can be used by researchers with various levels of bioinformatics experience.
- ChipSeeker: ChipSeeker is an R package that provides a range of tools for analyzing ChIP-seq data. It includes functions for annotation, and functional analysis, and can be used in conjunction with other R packages for data visualization.
- Pluto: A cloud-based platform gives scientists the ability to manage all of their data, run bioinformatics analyses, and create interactive and publication-quality and presentation ready visualizations. Contact the Pluto team to learn more about analyzing ChIP-seq.
- Other tools?: Let our team know and we can improve this post.
References
Image - ChIP sequencing. (2022, November 15). In Wikipedia. https://en.wikipedia.org/wiki/ChIP_sequencing